Q1
In which of the following examples of motion, can the body be considered
approximately a point object:
(a) a railway carriage moving without jerks between two stations.
(b) a monkey sitting on top of a man cycling smoothly on a circular track.
(c) a spinning cricket ball that turns sharply on hitting the ground.
(d) a tumbling beaker that has slipped off the edge of a table.
Concept Theory
In mechanics, a body can be treated as a point object (particle) when its size is negligible compared with the distance travelled or the scale of motion.
In such cases, the internal structure, rotation, and shape of the body do not affect the analysis of motion.
Mathematically, if
\( \text{Size of object} \ll \text{Distance of motion} \)
then the body may be approximated as a point object.
Solution Strategy (Thinking Map)
- Step 1 → Compare the size of the object with the distance travelled.
- Step 2 → If the size is negligible → treat as a point object.
- Step 3 → If the motion depends on rotation, tumbling, or size → cannot treat as a point object.
Concept Illustration
Solution
We examine each situation by comparing the object's size with the scale of motion.
(a) Railway carriage moving between two stations
The distance between stations is typically several kilometres, while the carriage length is only a few metres.
Since the carriage size is extremely small compared with the distance travelled, the carriage can be treated as a point object.
✔ Approximation valid
(b) Monkey sitting on a cyclist moving on a circular track
The radius of the circular track is much larger than the size of the monkey and cyclist.
Hence, their dimensions are negligible compared to the path of motion.
✔ Can be treated as a point object
(c) Spinning cricket ball turning sharply after hitting the ground
Here the motion depends on rotation, spin, and surface interaction.
The size and rotation of the ball significantly influence the motion.
✘ Cannot be treated as a point object
(d) Tumbling beaker falling from a table
The motion involves tumbling and rotation.
The orientation and size of the beaker affect how it falls and hits the ground.
✘ Cannot be approximated as a point object
Final Answer
Bodies can be treated as point objects in cases:
(a) and (b)
Q2
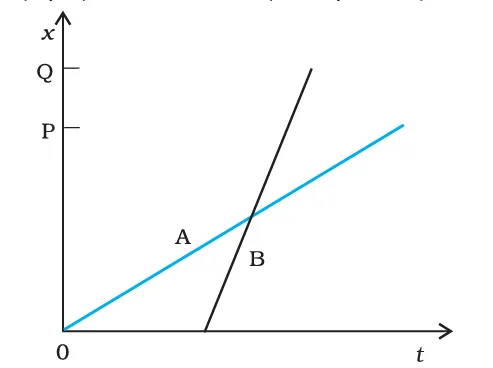
The position-time (x–t) graphs for two children A and B returning from their school
O to their homes P and Q respectively are shown in Fig. 2.9. Choose the correct
entries in the brackets below ;
(a) (A/B) lives closer to the school than (B/A)
(b) (A/B) starts from the school earlier than (B/A)
(c) (A/B) walks faster than (B/A)
(d) A and B reach home at the (same/different) time
(e) (A/B) overtakes (B/A) on the road (once/twice)
Concept Theory
A position–time (x–t) graph describes how the position of an object changes with time. Important interpretations are:
- The slope of the graph gives the velocity.
- A steeper slope represents greater speed.
- The starting point on the time axis shows when motion begins.
- The final position indicates the total distance from the origin.
- The intersection of two graphs means the two objects are at the same position at that time.
Solution Strategy (Graph Reading)
- Step 1 → Compare the final position of A and B (distance from school).
- Step 2 → Compare the starting times of both graphs.
- Step 3 → Compare the slopes to determine who walks faster.
- Step 4 → Check whether both graphs end at the same time.
- Step 5 → Count how many times the two graphs intersect.
Solution
(a) Who lives closer to the school?
The child whose final position on the graph is smaller lives closer to the school.
From the graph, point P (home of A) lies closer to the origin O than point Q (home of B).
✔ A lives closer to the school than B.
(b) Who starts earlier?
The motion begins at the point where the graph starts on the time axis.
The graph for A begins earlier than that for B.
✔ A starts from the school earlier than B.
(c) Who walks faster?
Speed corresponds to the slope of the x–t graph.
Since the line representing B is steeper, B has a greater speed.
✔ B walks faster than A.
(d) Do they reach home at the same time?
Both graphs terminate at the same value of time on the horizontal axis.
✔ A and B reach home at the same time.
(e) Overtaking
Overtaking occurs when the two position–time graphs intersect.
The graphs of A and B intersect once.
This means B catches up with A and then moves ahead.
✔ B overtakes A once.
Final Answers
- (a) A lives closer to the school than B
- (b) A starts earlier than B
- (c) B walks faster than A
- (d) They reach home at the same time
- (e) B overtakes A once
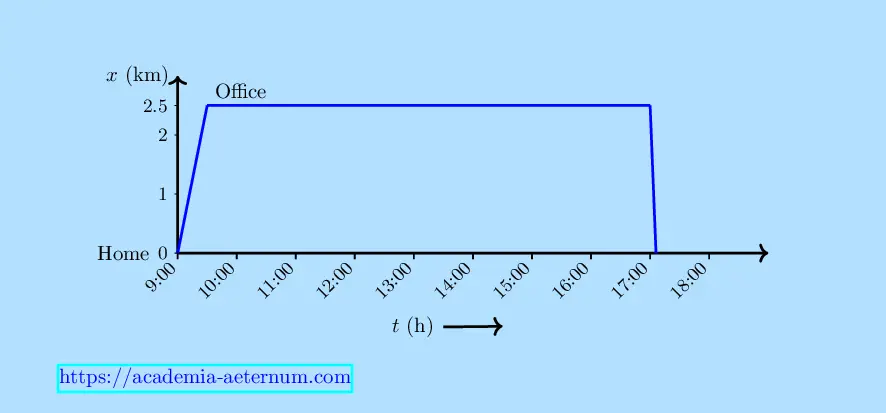
Q3 A woman starts from her home at 9.00 am, walks with a speed of \(5\ km\ h^{-1}\) on a straight road up to her office \(2.5\ km\) away, stays at the office up to 5.00 pm, and returns home by an auto with a speed of \(25\ km\ h^{-1}\). Choose suitable scales and plot the x–t graph of her motion.
Concept Theory
A position–time (x–t) graph represents how the position of an object changes with time.
- The slope of the graph represents velocity.
- A straight line with positive slope indicates uniform motion away from the origin.
- A horizontal line represents an object at rest.
- A straight line with negative slope represents motion towards the origin.
Solution Strategy
- Step 1 → Calculate the time taken to reach the office.
- Step 2 → Mark the time interval when she remains at rest.
- Step 3 → Calculate the return journey time.
- Step 4 → Plot the corresponding segments on the x–t graph.
Solution
1. Journey from home to officeDistance between home and office
\(x = 2.5\ km\)
Walking speed
\(v = 5\ km\ h^{-1}\)
Time taken
\[ t = \frac{x}{v} = \frac{2.5}{5} = 0.5\ h \]
\(0.5\ h = 30\ minutes\)
Therefore, she reaches the office at
9:30 am
2. Stay at the office
She remains at the office from
\(9:30\ am\) to \(5:00\ pm\)
During this period her position remains constant at
\(x = 2.5\ km\)
Hence the graph is a horizontal line.
3. Return journey
Distance from office to home
\(2.5\ km\)
Speed of auto
\(25\ km\ h^{-1}\)
Time taken
\[ t = \frac{2.5}{25} = 0.1\ h \]
\(0.1\ h = 6\ minutes\)
Thus she reaches home at approximately
5:06 pm
Key Points for the Graph
- (9:00 am , 0 km)
- (9:30 am , 2.5 km)
- (5:00 pm , 2.5 km)
- (5:06 pm , 0 km)
x–t Graph
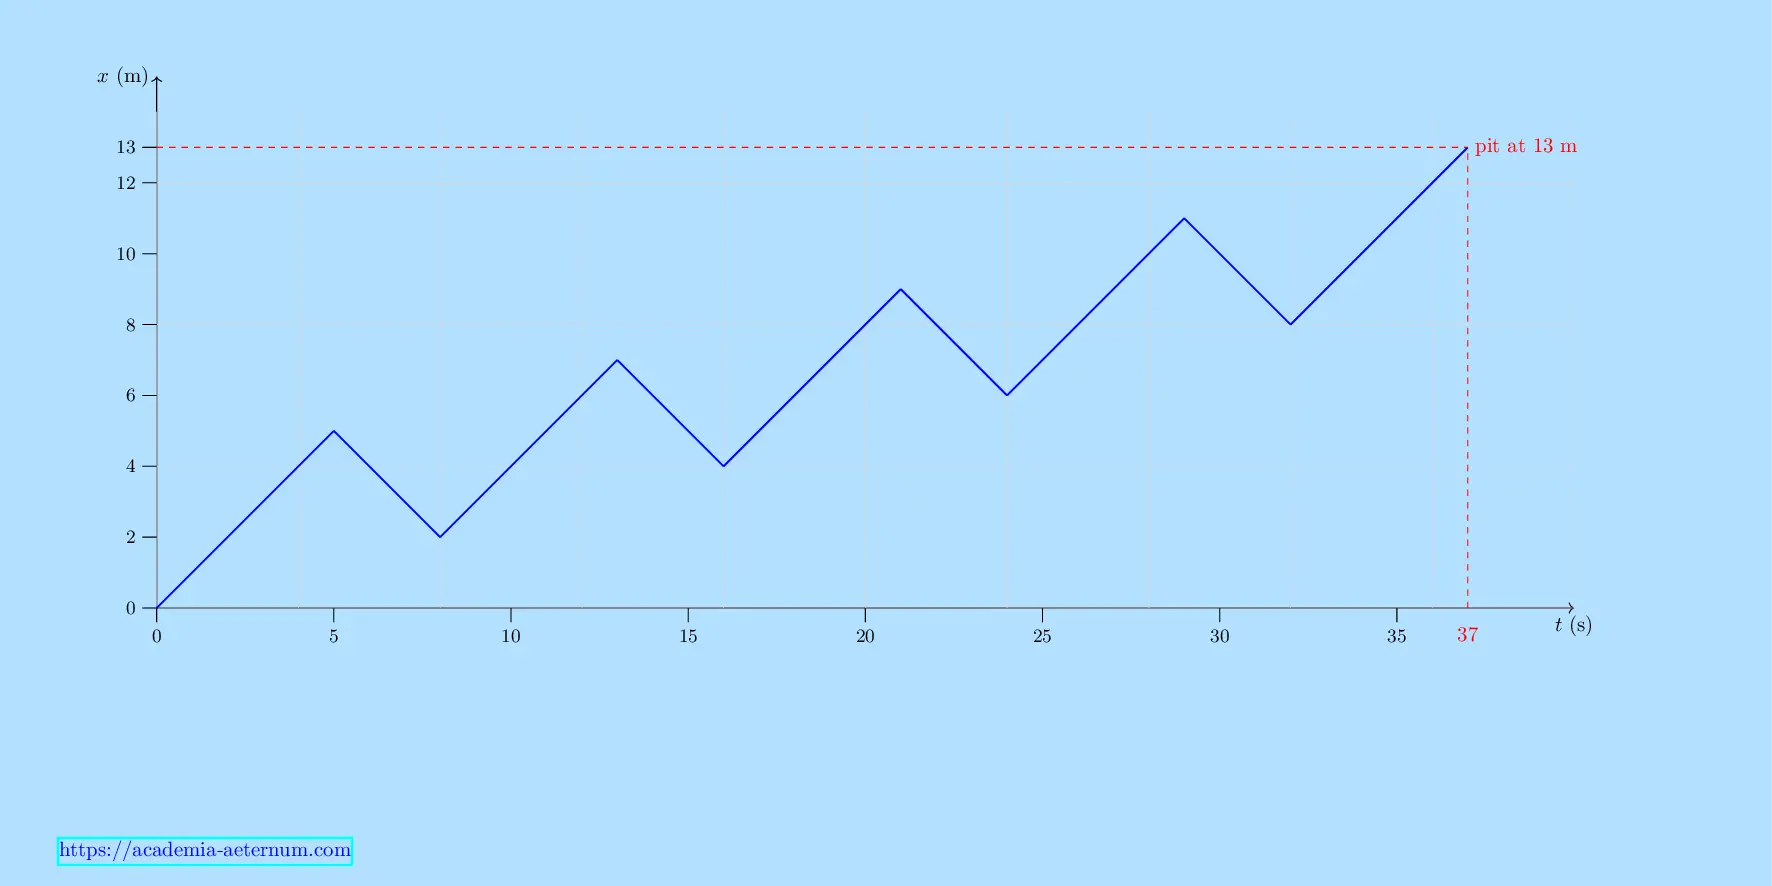
Q4 A drunkard walking in a narrow lane takes 5 steps forward and 3 steps backward, followed again by 5 steps forward and 3 steps backward, and so on. Each step is 1 m long and requires 1 s. Plot the x–t graph of his motion. Determine graphically and otherwise how long the drunkard takes to fall in a pit 13 m away from the start.
Concept Theory
In this motion the displacement does not increase uniformly because the drunkard alternates between forward and backward steps.
Therefore the x–t graph consists of zig-zag straight line segments:
- Positive slope → forward motion
- Negative slope → backward motion
- Each step corresponds to a change of 1 m in 1 s
Solution Strategy
- Step 1 → Determine the net displacement per cycle.
- Step 2 → Find how many full cycles occur before the final forward run.
- Step 3 → Calculate the remaining forward steps to reach the pit.
Given
Each step \(=1\text{ m}\) Time per step \(=1\text{ s}\) Pattern of motion: 5 steps forward → 3 steps backward (repeated)1. Net displacement in one cycle
Forward displacement \[ 5\text{ m} \] Backward displacement \[ 3\text{ m} \] Net displacement \[ 5-3 = 2\text{ m} \] Time for one cycle \[ 5+3 = 8\text{ s} \] Thus after \(n\) cycles \[ \text{Displacement}=2n\text{ m} \]2. Cycles before the last forward run
The pit is located at \[ 13\text{ m} \] During the last cycle the drunkard may fall during the **forward 5 steps**, so the final backward motion will not occur. Maximum forward displacement in that last run \[ 5\text{ m} \] Therefore displacement covered in complete cycles \[ 13-5=8\text{ m} \] Now \[ 2n=8 \] \[ n=4 \] Thus the drunkard completes **4 full cycles**. Time taken \[ 4\times8 = 32\text{ s} \] Position after 4 cycles \[ 8\text{ m} \]3. Final forward steps
From \(8\text{ m}\): 1 step → \(9\text{ m}\) (33 s) 2 steps → \(10\text{ m}\) (34 s) 3 steps → \(11\text{ m}\) (35 s) 4 steps → \(12\text{ m}\) (36 s) 5 steps → \(13\text{ m}\) (37 s) At this moment he reaches the pit.4. Total time
\[ \text{Total time} = 32 + 5 \] \[ = 37\text{ s} \]Therefore, the drunkard falls into the pit after 37 seconds.
Q5 A car moving along a straight highway with speed of \(126 \,\text{km h}^{-1}\) is brought to a stop within a distance of \(200 \,\text{m}\). What is the retardation of the car (assumed uniform), and how long does it take for the car to stop?
Concept Theory
When a body moving with an initial velocity slows down uniformly, the motion is described by the equations of uniformly accelerated motion.
- \(v = u + at\)
- \(v^2 - u^2 = 2as\)
Since the car is being stopped, the acceleration is opposite to the direction of motion, hence it represents retardation (negative acceleration).
Solution Strategy
- Step 1 → Convert the speed from km h\(^{-1}\) to m s\(^{-1}\).
- Step 2 → Use \(v^2-u^2=2as\) to find acceleration.
- Step 3 → Use \(v=u+at\) to determine the stopping time.
Given
Initial speed \[ u = 126\ \text{km h}^{-1} \] Stopping distance \[ s = 200\ \text{m} \] Final velocity \[ v = 0 \]1. Convert speed into SI units
\[ 126 \,\text{km h}^{-1} = \frac{126 \times 1000}{3600} \,\text{m s}^{-1} \] \[ = \frac{126 \times 5}{18} \] \[ = 35 \,\text{m s}^{-1} \] Thus \[ u = 35 \,\text{m s}^{-1} \]2. Retardation of the car
Using the equation \[ v^2 - u^2 = 2as \] Substituting values \[ 0^2 - (35)^2 = 2 \times a \times 200 \] \[ -1225 = 400a \] \[ a = \frac{-1225}{400} \] \[ a \approx -3.06 \,\text{m s}^{-2} \] The negative sign shows the acceleration is opposite to the motion.Retardation = \(3.06 \,\text{m s}^{-2}\)
3. Time taken to stop
Using \[ v = u + at \] Substituting values \[ 0 = 35 - 3.06t \] \[ 3.06t = 35 \] \[ t = \frac{35}{3.06} \] \[ t \approx 11.44\ \text{s} \]Final Answer
Retardation of the car:
\[ 3.06 \,\text{m s}^{-2} \]Time taken to stop:
\[ 11.44 \,\text{s} \]Q6
A player throws a ball upwards with an initial speed of \(29.4\,\text{m s}^{-1}\).(a) What is the direction of acceleration during the upward motion of the ball?
(b) What are the velocity and acceleration of the ball at the highest point of its motion?
(c) Choose \(x=0\) and \(t=0\) to be the location and time of the ball at its highest point, vertically downward direction to be the positive direction of the x-axis, and give the signs of position, velocity and acceleration during the upward and downward motion.
(d) To what height does the ball rise and after how long does the ball return to the player's hands? (Take \(g=9.8\,\text{m s}^{-2}\) and neglect air resistance.)
Concept Theory
When a body is projected vertically upward, the only force acting on it (neglecting air resistance) is gravity. Therefore the acceleration remains constant and directed downward throughout the motion.
- Acceleration due to gravity is constant.
- Velocity becomes zero momentarily at the highest point.
- Time of ascent equals time of descent in symmetric vertical motion.
Solution Strategy
- Use concepts of gravitational acceleration.
- Apply kinematic equations of uniformly accelerated motion.
- Use symmetry of vertical motion to determine total time.
Solution
(a) Direction of acceleration
During the entire motion, the only acceleration acting on the ball is the acceleration due to gravity.
This acceleration always acts vertically downward towards the centre of the Earth, irrespective of whether the ball is moving upward or downward.
Direction of acceleration: downward.
(b) Velocity and acceleration at the highest point
At the highest point, the ball momentarily comes to rest.
\[ v = 0 \]
However, gravity continues to act on the ball, so acceleration remains
\[ a = 9.8\,\text{m s}^{-2} \]
directed vertically downward.
(c) Sign convention for position, velocity and acceleration
The highest point is chosen as the origin (\(x=0\)), and the downward direction is taken as positive.
| Motion | Position \(x\) | Velocity \(v\) | Acceleration \(a\) |
|---|---|---|---|
| Upward motion | Negative | Negative | Positive |
| Downward motion | Positive | Positive | Positive |
Acceleration remains positive because it is always directed downward.
(d) Maximum height reached
Initial velocity
\[ u = 29.4\,\text{m s}^{-1} \]Acceleration
\[ a = -9.8\,\text{m s}^{-2} \]At the highest point
\[ v = 0 \] Using \[ v^2 - u^2 = 2ah \] \[ 0 - (29.4)^2 = 2(-9.8)h \] \[ h = \frac{(29.4)^2}{2\times9.8} \] \[ h = 44.1\,\text{m} \]Maximum height = \(44.1\,\text{m}\)
Time to reach the highest point Using \[ v = u - gt \] \[ 0 = 29.4 - 9.8t \] \[ t = \frac{29.4}{9.8} \] \[ t = 3\,\text{s} \]
Total time of flight
For symmetric vertical motion
\[ T = 2t \] \[ T = 2\times3 \] \[ T = 6\,\text{s} \]The ball returns to the player's hands after \(6\,\text{s}\).
Q7
Read each statement below carefully and state with reasons and examples if it is
true or false. A particle in one-dimensional motion:
(a) with zero speed at an instant may have non-zero acceleration at that instant
(b) with zero speed may have non-zero velocity
(c) with constant speed must have zero acceleration
(d) with positive value of acceleration must be speeding up
Concept Theory
In one-dimensional motion:
- Speed is the magnitude of velocity.
- Velocity describes both magnitude and direction of motion.
- Acceleration represents the rate of change of velocity.
The sign of velocity and acceleration determines whether the object is speeding up or slowing down.
Solution Strategy
- Recall definitions of speed, velocity and acceleration.
- Analyse whether each statement is consistent with physical examples.
Solution
(a) Zero speed but non-zero acceleration
A particle may momentarily have zero speed but still experience acceleration.
Example: A ball thrown vertically upward has zero speed at the highest point, yet gravity continues to act on it.
Acceleration remains \[ 9.8\,\text{m s}^{-2} \] directed downward.
Statement (a) — True
(b) Zero speed but non-zero velocity
Speed is the magnitude of velocity.
If speed is zero, the magnitude of velocity is zero, so the velocity itself must also be zero.
Statement (b) — False
(c) Constant speed implies zero acceleration
In one-dimensional motion, constant speed means velocity remains constant (because the direction does not change).
Since acceleration is the rate of change of velocity, the acceleration must be zero.
Example: A car moving along a straight road at a steady speed.
Statement (c) — True
(d) Positive acceleration implies speeding up
Positive acceleration means velocity is increasing in the positive direction.
However, if the velocity is negative while acceleration is positive, the particle actually slows down.
Example: A ball moving upward while gravity acts downward.
Statement (d) — False
Final Summary
| Statement | Answer |
|---|---|
| (a) | True |
| (b) | False |
| (c) | True |
| (d) | False |
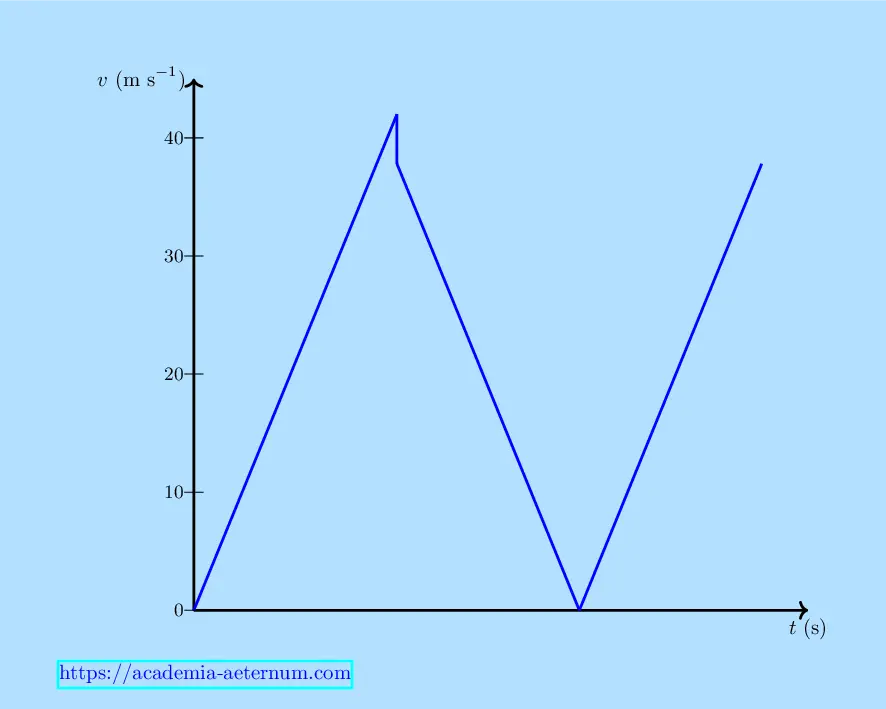
Q8 A ball is dropped from a height of 90 m on a floor. At each collision with the floor, the ball loses one tenth of its speed. Plot the speed–time graph of its motion between \(t = 0\) to \(12\,\text{s}\).
Concept Theory
When a body falls freely under gravity, its speed increases uniformly with time. During a collision with the ground, the direction of velocity reverses and the speed decreases due to loss of energy.
In a speed–time graph:
- Straight line segments represent uniform acceleration due to gravity.
- Sudden vertical drops represent instantaneous changes in speed during collisions.
Solution Strategy
- Determine the speed just before the first collision.
- Calculate the time taken to reach the ground.
- Find the reduced speed after the bounce.
- Determine the time for the upward and downward motion after the bounce.
- Plot the corresponding points on the speed–time graph.
Given
Height of fall \[ h = 90\,\text{m} \] Acceleration due to gravity \[ g = 9.8\,\text{m s}^{-2} \] Initial velocity \[ u = 0 \]1. Speed just before the first collision
Using \[ v^2 - u^2 = 2gh \] \[ v^2 = 2 \times 9.8 \times 90 \] \[ v^2 = 1764 \] \[ v = 42\,\text{m s}^{-1} \] Thus the speed just before hitting the ground is\(42\,\text{m s}^{-1}\)
2. Time taken to reach the ground
Using \[ v = u + gt \] \[ 42 = 9.8t \] \[ t = \frac{42}{9.8} \] \[ t \approx 4.3\,\text{s} \] Thus the first collision occurs at\(t \approx 4.3\,\text{s}\)
3. Speed just after the bounce
The ball loses one tenth of its speed. \[ v_1 = 42 - 0.1 \times 42 \] \[ v_1 = 37.8\,\text{m s}^{-1} \] This velocity is directed upward.4. Time to reach maximum height after bounce
Using \[ v = u - gt \] \[ 0 = 37.8 - 9.8t \] \[ t = \frac{37.8}{9.8} \] \[ t \approx 3.86\,\text{s} \] Thus the ball reaches maximum height at \[ 4.3 + 3.86 \approx 8.16\,\text{s} \]5. Time for the complete second flight
Total time for upward and downward motion \[ T = 2 \times 3.86 \] \[ T = 7.72\,\text{s} \] Thus the second impact occurs at \[ 4.3 + 7.72 \approx 12.02\,\text{s} \] which is approximately \(12\,\text{s}\).Key Points for the Speed–Time Graph
- \(t = 0\), speed \(= 0\,\text{m s}^{-1}\)
- \(t \approx 4.3\,\text{s}\), speed \(= 42\,\text{m s}^{-1}\)
- Immediately after bounce → \(37.8\,\text{m s}^{-1}\)
- \(t \approx 8.16\,\text{s}\), speed \(= 0\)
- \(t \approx 12.02\,\text{s}\), speed \(= 37.8\,\text{m s}^{-1}\)
These points produce the piecewise straight-line speed–time graph shown.
Q9
Explain clearly, with examples, the distinction between:
(a) magnitude of displacement (sometimes called distance) over an interval of time,
and the total length of path covered by a particle over the same interval;
(b) magnitude of average velocity over an interval of time, and the average speed
over the same interval.
[Average speed of a particle over an interval of time is defined as the total path length divided by the time
interval].
Show in both (a) and (b) that the second quantity is either greater than or equal to
the first. When is the equality sign true?
(Consider one-dimensional motion only.)
Concept Theory
In one-dimensional motion, two types of quantities are often compared:
- Quantities based on displacement (straight-line change in position).
- Quantities based on actual path length travelled.
Since the path taken can include forward and backward motion, the total path length is always greater than or equal to the magnitude of displacement.
Solution
(a) Magnitude of displacement vs total path length
The magnitude of displacement is the straight-line distance between the initial and final positions of a particle.
\[ |\Delta x| = |x_{\text{final}} - x_{\text{initial}}| \]The total path length is the complete distance travelled along the path, including any back-and-forth motion.
Example: If a particle moves from \(x=0\) m to \(x=10\) m and then returns to \(x=4\) m:
Magnitude of displacement:
\[ |4 - 0| = 4\ \text{m} \]Total path length:
\[ 10 + 6 = 16\ \text{m} \]Thus,
\[ \text{path length} \geq \text{magnitude of displacement} \]Equality occurs only when the motion is entirely in one direction without reversing.
(b) Magnitude of average velocity vs average speed
The magnitude of average velocity is defined as
\[ |\bar{v}| = \frac{|\Delta x|}{\Delta t} \]where \( \Delta x \) is the displacement.
The average speed is defined as
\[ \text{average speed} = \frac{\text{total path length}}{\Delta t} \]Using the previous example, suppose the motion occurs in \(7\,\text{s}\).
Magnitude of average velocity:
\[ |\bar{v}| = \frac{4}{7}\ \text{m s}^{-1} \]Average speed:
\[ \text{average speed} = \frac{16}{7}\ \text{m s}^{-1} \]Thus,
\[ \text{average speed} \geq |\bar{v}| \]Equality occurs only when the particle moves in a single direction without reversing, so that
\[ \text{path length} = |\text{displacement}| \]Final Conclusion
- \(\text{Path length} \geq |\text{displacement}|\)
- \(\text{Average speed} \geq |\text{average velocity}|\)
Equality holds only when the particle moves in one direction without changing its direction.
Q10
A man walks on a straight road from his home to a market 2.5 km away with
a speed of 5 km h\(^{-1}\). Finding the market closed, he instantly turns and
walks back home with a speed of 7.5 km h\(^{-1}\). What is the
(a) magnitude of average velocity, and
(b) average speed of the man over the interval of time
(i) 0 to 30 min,
(ii) 0 to 50 min,
(iii) 0 to 40 min ?
Concept Theory
- Average velocity = displacement / time
- Average speed = total distance / time
Average velocity depends on the net displacement, whereas average speed depends on the total distance travelled.
Given
Distance to market \[ 2.5\ \text{km} \] Speed towards market \[ 5\ \text{km h}^{-1} \] Speed while returning \[ 7.5\ \text{km h}^{-1} \]1. Time to reach the market
\[ t=\frac{\text{distance}}{\text{speed}} \] \[ t=\frac{2.5}{5}=0.5\ \text{h}=30\ \text{min} \] Thus he reaches the market at **30 min**.2. Time to return home
\[ t=\frac{2.5}{7.5} \] \[ t=\frac{1}{3}\ \text{h}=20\ \text{min} \] Thus he reaches home again at \[ 30 + 20 = 50\ \text{min} \]Required calculations
(i) Interval: 0–30 min
At 30 min he reaches the market. Displacement \[ 2.5\ \text{km} \] Distance travelled \[ 2.5\ \text{km} \] Time \[ 0.5\ \text{h} \] Average velocity \[ \frac{2.5}{0.5}=5\ \text{km h}^{-1} \] Average speed \[ \frac{2.5}{0.5}=5\ \text{km h}^{-1} \](ii) Interval: 0–50 min
At 50 min he returns home. Displacement \[ 0 \] Total distance travelled \[ 2.5+2.5=5\ \text{km} \] Time \[ \frac{5}{6}\ \text{h} \] Average velocity \[ 0 \] Average speed \[ \frac{5}{5/6}=6\ \text{km h}^{-1} \](iii) Interval: 0–40 min
40 min \(=\frac{2}{3}\) h After reaching the market at 30 min, he walks back for **10 min**. \[ 10\ \text{min}=\frac{1}{6}\ \text{h} \] Distance covered during return \[ 7.5\times\frac{1}{6}=1.25\ \text{km} \] Position relative to home \[ 2.5-1.25=1.25\ \text{km} \] Displacement \[ 1.25\ \text{km} \] Total distance travelled \[ 2.5+1.25=3.75\ \text{km} \] Average velocity \[ \frac{1.25}{2/3}=1.875\ \text{km h}^{-1} \] Average speed \[ \frac{3.75}{2/3}=5.625\ \text{km h}^{-1} \]Final Results
Average velocity
- 0–30 min → \(5\ \text{km h}^{-1}\)
- 0–50 min → \(0\)
- 0–40 min → \(1.875\ \text{km h}^{-1}\)
Average speed
- 0–30 min → \(5\ \text{km h}^{-1}\)
- 0–50 min → \(6\ \text{km h}^{-1}\)
- 0–40 min → \(5.625\ \text{km h}^{-1}\)
Q11 In Exercises 2.9 and 2.10, we have carefully distinguished between average speed and magnitude of average velocity. No such distinction is necessary when we consider instantaneous speed and magnitude of velocity. The instantaneous speed is always equal to the magnitude of instantaneous velocity. Why?
Concept Theory
Average quantities are calculated over a finite time interval, while instantaneous quantities are defined over an infinitesimally small time interval.
Over finite intervals, a particle may change direction or move along a curved path, so the distance travelled can be greater than the magnitude of displacement. Hence,
\[ \text{average speed} \ge |\text{average velocity}| \]However, instantaneous quantities are defined in the limit as the time interval approaches zero.
Solution
Instantaneous speed is defined as
\[ v_{\text{speed}} = \lim_{\Delta t \to 0} \frac{\Delta s}{\Delta t} \]where \( \Delta s \) is the small distance travelled in time \( \Delta t \).
Instantaneous velocity is the vector
\[ \vec{v} = \lim_{\Delta t \to 0} \frac{\Delta \vec{x}}{\Delta t} \]and its magnitude is
\[ |\vec{v}| = \lim_{\Delta t \to 0} \frac{|\Delta \vec{x}|}{\Delta t} \]When \( \Delta t \to 0 \), the motion during that extremely small interval is effectively along a straight line. Therefore the distance travelled becomes equal to the magnitude of displacement:
\[ \Delta s = |\Delta \vec{x}| \]Hence,
\[ \text{instantaneous speed} = |\text{instantaneous velocity}| \]Example
Consider a car moving along a circular track. Over a full lap the average velocity may be zero because the displacement is zero, while the average speed is non-zero.
But at any particular instant, the car has a velocity directed along the tangent to the circular path, and the speedometer reading gives the magnitude of this velocity. Thus,
instantaneous speed = magnitude of instantaneous velocity.
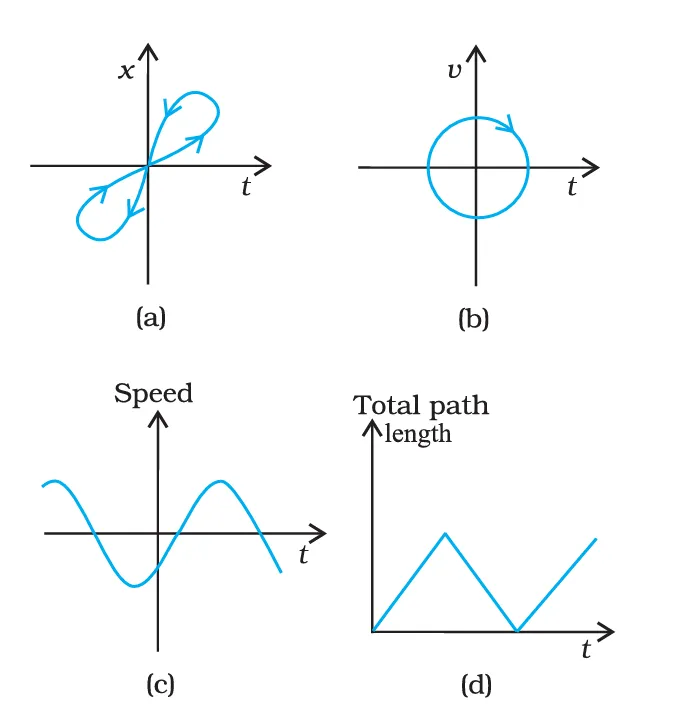
Q12 Look at the graphs (a) to (d) (Fig. 2.10) carefully and state, with reasons, which of these cannot possibly represent one-dimensional motion of a particle.
Concept Used
- At any instant of time, a particle can have only one position.
- Similarly, it can have only one velocity at a given time.
- Speed (magnitude of velocity) cannot be negative.
- Total path length can only increase or remain constant with time.
Solution
None of the graphs (a)–(d) can represent one-dimensional motion of a particle.
(a) x–t graph
In one-dimensional motion, a particle must have only one position at a given time.
In graph (a), the curve intersects itself. This means that at the same time \(t\), two different values of position \(x\) correspond to the particle.
This is physically impossible.
(b) v–t graph
For a given instant of time, a particle can have only one velocity.
Graph (b) forms a closed loop (circle), implying that for the same value of \(t\), two different velocities exist.
This cannot represent real motion.
(c) speed–t graph
Speed is the magnitude of velocity and is always non-negative.
In graph (c), part of the curve lies below the time axis, indicating negative speed.
Negative speed is not physically meaningful.
(d) path length–t graph
Total path length represents the cumulative distance travelled.
It can either remain constant (if the particle is at rest) or increase with time, but it can never decrease.
Graph (d) shows a downward slope, implying that the total path length decreases.
This is impossible in physical motion.
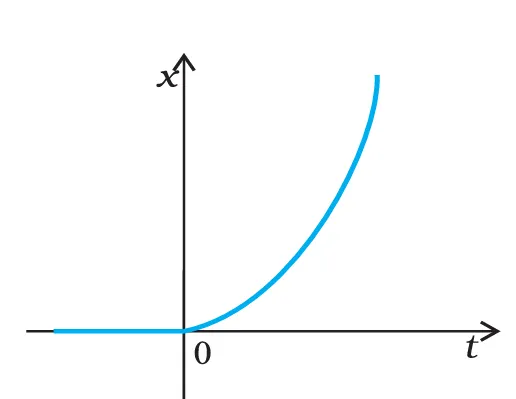
Q13 Figure 2.11 shows the \(x\)-\(t\) plot of one-dimensional motion of a particle. Is it correct to say from the graph that the particle moves in a straight line for \(t<0\) and on a parabolic path for \(t>0\)? If not, suggest a suitable physical context for this graph.
Solution
Is the given interpretation correct?
No, it is not correct to say that the particle moves on a straight path for \(t<0\) and on a parabolic path for \(t>0\).
Reason
The graph shown is a position–time (\(x\)-\(t\)) graph, not a spatial trajectory.
The horizontal axis represents time, not another spatial coordinate. Therefore the shape of the curve does not represent the geometric path of the particle in space.
A statement such as “straight path” or “parabolic path” refers to the trajectory in space, which would require a graph such as \(y\) vs \(x\). An \(x\)-\(t\) graph only describes how the position coordinate changes with time along a one-dimensional line.
Interpretation of the graph
From the graph:
- For \(t<0\): the graph is horizontal, so the position \(x\) is constant. This means the particle is at rest.
- For \(t>0\): the graph is curved upward and its slope increases with time. Since slope of an \(x\)-\(t\) graph represents velocity, the increasing slope indicates that the velocity is increasing.
Thus the particle begins to move with increasing velocity, which indicates uniform acceleration.
Suitable physical context
A possible physical situation represented by this graph is:
- A body initially at rest for \(t<0\).< /li>
- At \(t=0\), a constant force begins to act on the body.
- The body then moves along a straight line with constant acceleration.
Another example is an object released from rest at \(t=0\) and then falling freely under gravity.
Q14 A police van moving on a highway with a speed of 30 km h\(^{-1}\) fires a bullet at a thief’s car speeding away in the same direction with a speed of 192 km h\(^{-1}\). If the muzzle speed of the bullet is 150 m s\(^{-1}\), with what speed does the bullet hit the thief’s car? (Note: Obtain the speed relevant for damaging the thief’s car.)
Concept Used
The relevant speed for impact is the relative speed of the bullet with respect to the thief’s car.
Relative velocity is given by
\[ v_{A/B}=v_A-v_B \]when both bodies move in the same direction.
Given
Police van speed \[ v_p = 30\ \text{km h}^{-1} \] Thief’s car speed \[ v_t = 192\ \text{km h}^{-1} \] Muzzle speed of bullet \[ v_m = 150\ \text{m s}^{-1} \]Step 1: Convert vehicle speeds into SI units
\[ v_p=\frac{30\times1000}{3600} \] \[ v_p \approx 8.33\ \text{m s}^{-1} \] \[ v_t=\frac{192\times1000}{3600} \] \[ v_t \approx 53.33\ \text{m s}^{-1} \]Step 2: Bullet speed relative to the ground
The muzzle speed is measured relative to the police van. Therefore the bullet’s speed relative to the ground is
\[ v_b = v_m + v_p \] \[ v_b = 150 + 8.33 \] \[ v_b = 158.33\ \text{m s}^{-1} \]Step 3: Bullet speed relative to the thief’s car
Since both the bullet and the thief’s car move in the same direction, the relative speed is
\[ v_{\text{bullet w.r.t car}} = v_b - v_t \] \[ = 158.33 - 53.33 \] \[ = 105\ \text{m s}^{-1} \]Final Answer
The bullet hits the thief’s car with a speed of \(105\ \text{m s}^{-1}\).
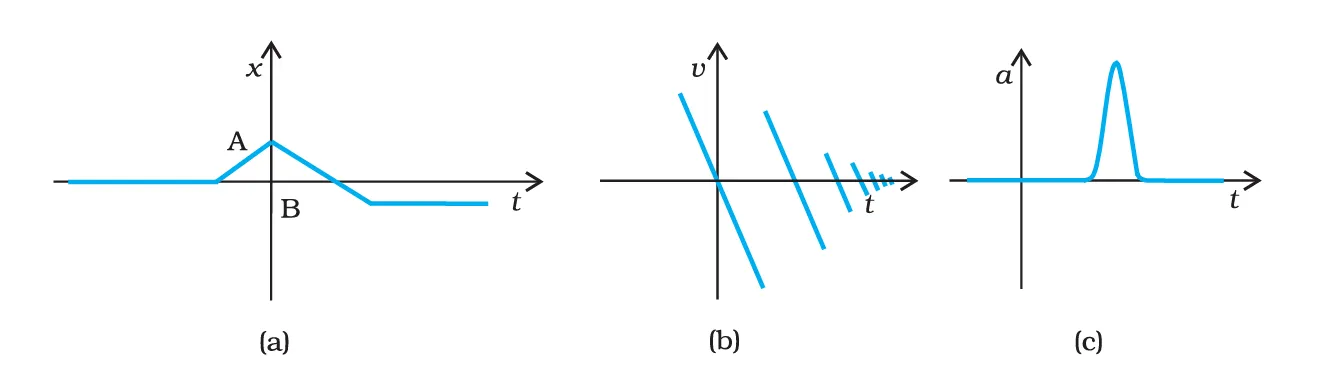
Q15 Suggest a suitable physical situation for each of the following graphs (Fig. 2.12).
Solution
A possible physical situation corresponding to each graph is described below.
(a) x–t graph
In this graph the slope of the \(x\)-\(t\) curve represents velocity.
- Initially the graph has a constant positive slope → motion with constant velocity in the positive \(x\)-direction.
- The slope gradually becomes zero → the particle momentarily comes to rest.
- The slope then becomes negative → the particle moves in the opposite direction with constant velocity.
Physical example: A ball rolling on a smooth floor towards a wall, stopping momentarily on collision, and then rebounding back with a smaller speed.
(b) v–t graph
The velocity changes sign at regular intervals while its magnitude gradually decreases.
This indicates repeated reversals of direction with decreasing speed.
Physical example: A ball dropped on a hard floor. After each bounce it rebounds upward with smaller speed, falls again, and the process repeats until it eventually comes to rest.
(c) a–t graph
The acceleration is zero for most of the time but shows a sharp peak for a very short duration.
This represents a brief impulsive force acting on the particle.
Physical example: A cricket ball moving horizontally that is suddenly struck by a bat. During the very short contact time the ball experiences a large acceleration, while before and after the impact the acceleration is nearly zero.
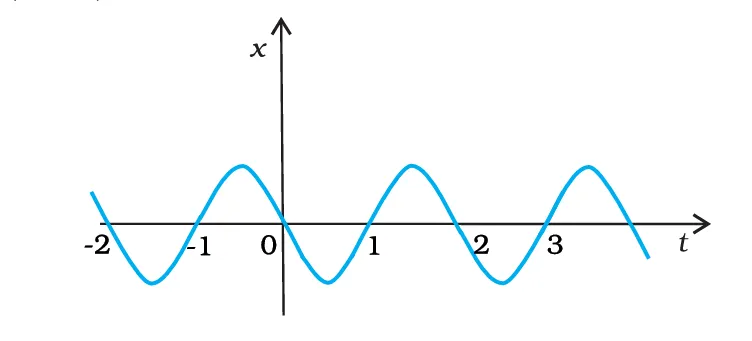
Q16 Figure 2.13 gives the \(x\)-\(t\) plot of a particle executing one-dimensional simple harmonic motion. (You will learn about this motion in more detail in Chapter 13). Give the signs of position, velocity and acceleration of the particle at \(t = 0.3\,\text{s},\; 1.2\,\text{s},\; -1.2\,\text{s}\).
Solution
Concept Used
- The slope of an \(x\)-\(t\) graph gives the velocity.
- In simple harmonic motion, \[ a=-\omega^2 x \] so the acceleration always has the opposite sign to the displacement.
At \(t = 0.3\,\text{s}\)
From the graph, the particle lies below the origin.
- Position: \(x<0\)< /li>
- The graph is sloping downward → velocity \(v<0\)< /li>
- Since \(a=-\omega^2 x\) and \(x<0\), acceleration \(a>0\)
At \(t = 1.2\,\text{s}\)
- Position: \(x>0\)
- The graph is rising → velocity \(v>0\)
- Since \(x>0\), acceleration \(a<0\)< /li>
At \(t = -1.2\,\text{s}\)
- Position: \(x<0\)< /li>
- The graph rises as time increases → velocity \(v>0\)
- Since \(x<0\), acceleration \(a>0\)
Final Signs
| Time | Position \(x\) | Velocity \(v\) | Acceleration \(a\) |
|---|---|---|---|
| 0.3 s | \(x<0\)< /td> | \(v<0\)< /td> | \(a>0\) |
| 1.2 s | \(x>0\) | \(v>0\) | \(a<0\)< /td> |
| -1.2 s | \(x<0\)< /td> | \(v>0\) | \(a>0\) |
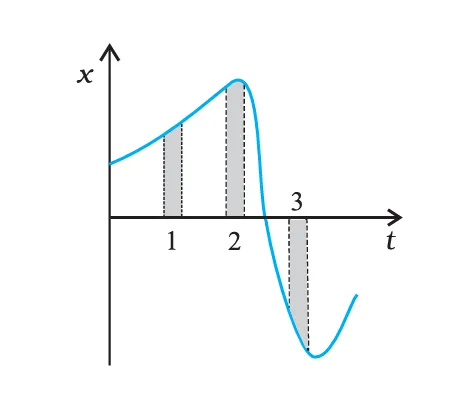
Q17 Figure 2.14 gives the \(x\)-\(t\) plot of a particle in one-dimensional motion. Three different equal intervals of time are shown. In which interval is the average speed greatest, and in which is it the least? Give the sign of average velocity for each interval.
Concept Used
- The slope of an \(x\)-\(t\) graph represents velocity.
- The magnitude of the slope represents the speed.
- Positive slope → positive velocity.
- Negative slope → negative velocity.
Solution
Interval 1
The graph rises with time and has a moderate positive slope.
- Average velocity → positive
- Average speed → moderate
Interval 2
The graph rises very gently, meaning the slope is small.
- Average velocity → positive
- Average speed → smallest
Interval 3
The graph slopes downward steeply.
- Average velocity → negative
- Average speed → greatest (largest magnitude of slope)
Final Answer
- Greatest average speed: Interval 3
- Least average speed: Interval 2
| Interval | Average Speed | Sign of Average Velocity |
|---|---|---|
| 1 | Moderate | Positive |
| 2 | Least | Positive |
| 3 | Greatest | Negative |
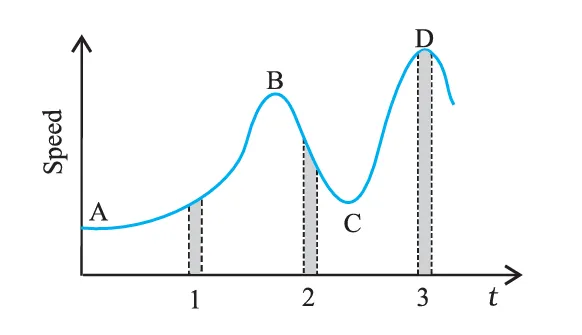
Q18 Figure 2.15 gives a speed–time graph of a particle in motion along a constant direction. Three equal intervals of time are shown.
(i) In which interval is the average acceleration greatest in magnitude?
(ii) In which interval is the average speed greatest?
(iii) Taking the direction of motion as positive, give the signs of \(v\) and \(a\) in the three intervals.
(iv) What are the accelerations at the points A, B, C and D?
Concept Used
- Slope of a speed–time graph gives acceleration.
- Average acceleration over an interval equals the slope of the line joining the endpoints.
- Average speed corresponds to the average height of the curve over that interval.
Solution
1. Interval with greatest average acceleration (magnitude)
The steepness of the graph indicates acceleration. The curve falls most steeply between B and C.
Therefore, the magnitude of average acceleration is greatest in interval 2.
2. Interval with greatest average speed
Average speed depends on the average height of the speed–time graph. The speeds are highest during interval 3.
Hence, average speed is greatest in interval 3.
3. Signs of velocity and acceleration
Since motion is along a fixed direction and the graph shows speed, the velocity remains positive throughout.
| Interval | Sign of Velocity \(v\) | Sign of Acceleration \(a\) |
|---|---|---|
| 1 (A → B) | \(v>0\) | \(a>0\) (speed increasing) |
| 2 (B → C) | \(v>0\) | \(a<0\) (speed decreasing) |
| 3 (C → D) | \(v>0\) | \(a>0\) (speed increasing) |
4. Accelerations at points A, B, C, D
- A: Curve is rising → slope positive → \(a>0\).
- B: Local maximum of speed → slope zero → \(a=0\).
- C: Local minimum of speed → slope zero → \(a=0\).
- D: At the top of the next peak → slope zero → \(a=0\). (Just before D, \(a>0\); just after D, \(a<0\)).< /li>
Final Answers
- Greatest magnitude of average acceleration → Interval 2
- Greatest average speed → Interval 3
Interactive Speed–Time Graph
Move the slider to see the tangent and instantaneous acceleration.
Instantaneous acceleration ≈ 0
Interactive Speed–Time Graph
Click a point to see the tangent and instantaneous acceleration.
Drag on the Curve to See Instantaneous Acceleration
Move the yellow point along the graph.
Interactive Motion Simulator
Drag the yellow point on the graph. The particle motion and acceleration update instantly.
Kinematics Visualizer
Move the time slider to see how position, velocity, and acceleration are related.
Kinematics Graph Lab
Draw a velocity–time (v–t) graph below. The simulator will generate x–t and a–t graphs automatically.
Draw by dragging inside the v–t region.